blue and white smoke illustration

Marketing Services - Experts Insights - AI Automations

Big Enterprise
Marketing Services to Scale your Services
Small Business
Customized Marketing Services for Small Businesses

Our Services

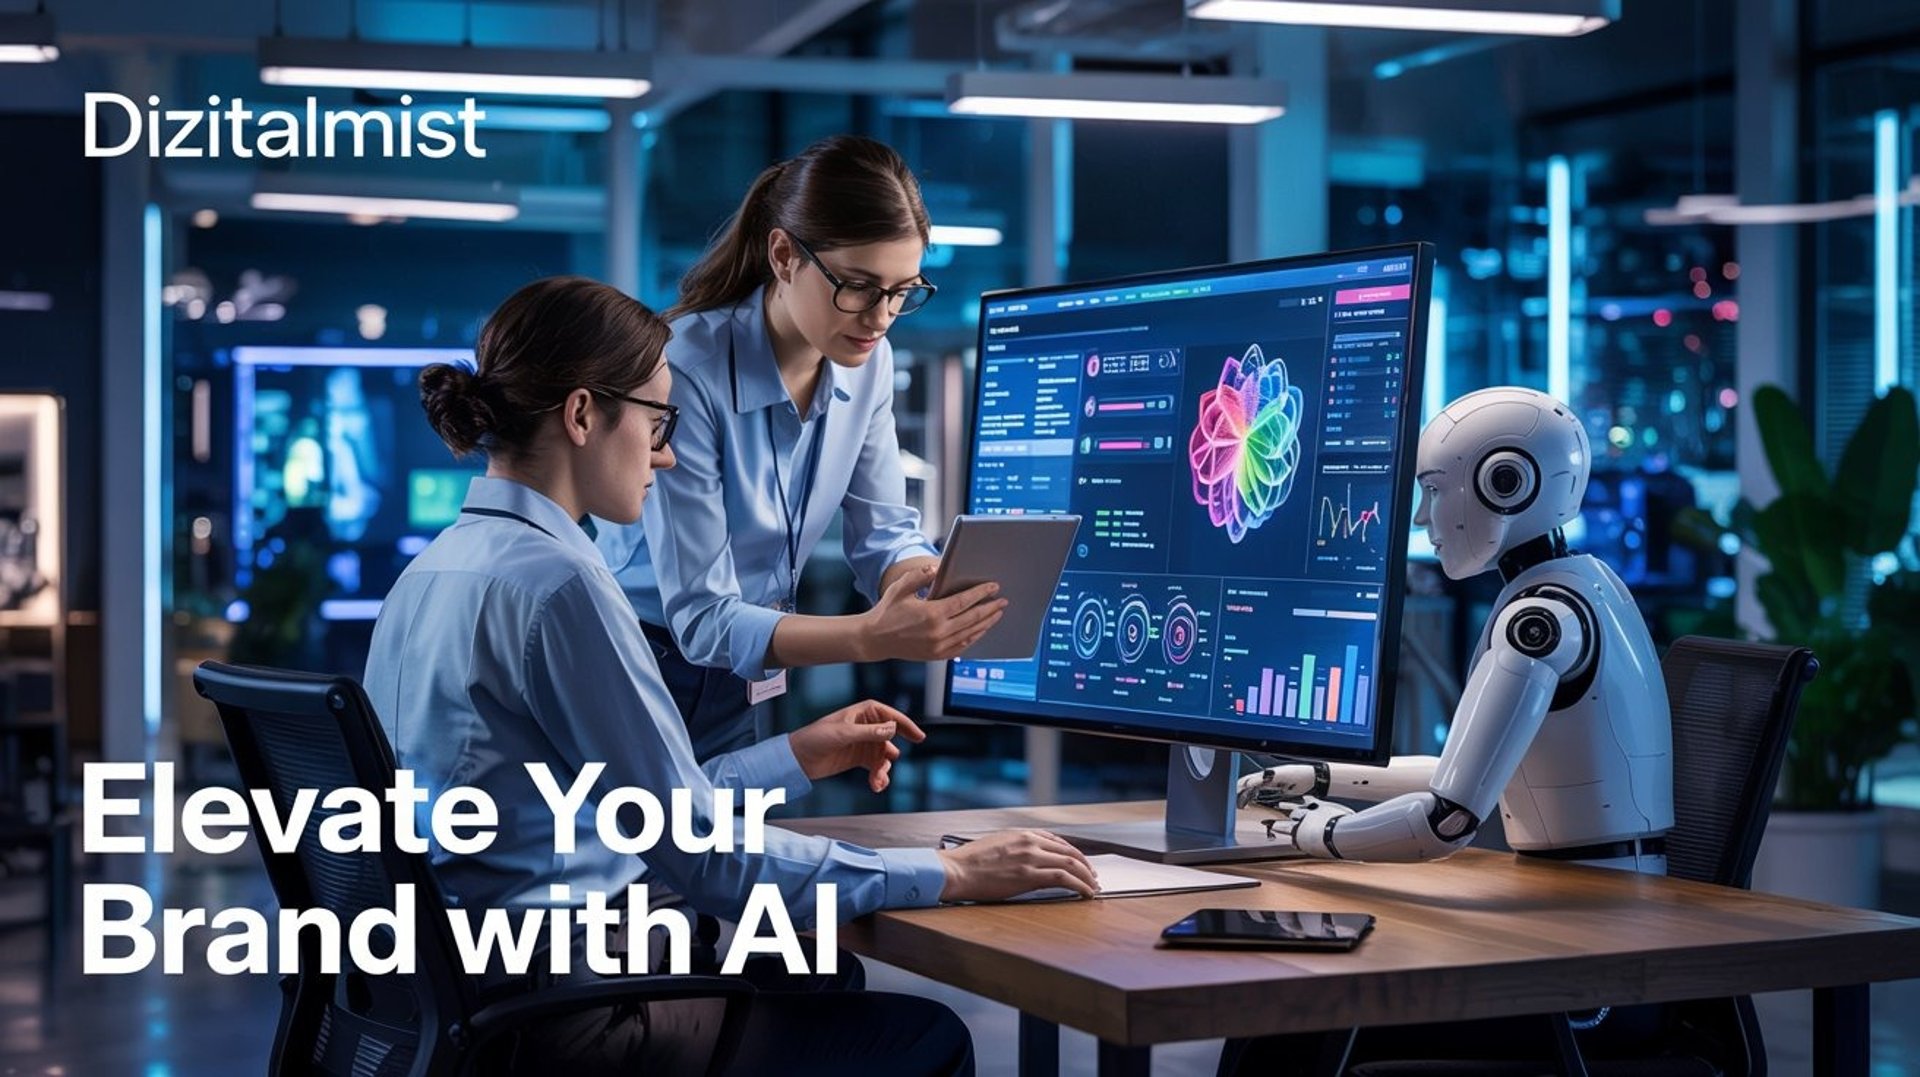
Use a fractional CXO at no cost, pay for services only. We blend human intelligence and AI analytics for guaranteed results .

Go-to-Market (GTM) Solutions
  • GTM Strategy Development

  • Sales Enablement & Playbooks

  • Demand Generation & Growth

  • Customer Onboarding & Training

  • GTM Advisory (Part-time CMO)

  • Partner & Influencer Marketing

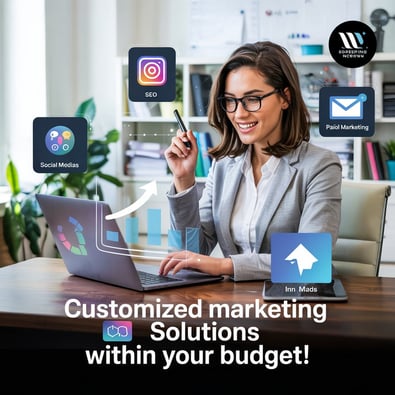
Digital Marketing Services
  • Website Designing & Hosting

  • Email List Generation

  • Performance Marketing & Advertising

  • Search Engine Optimization (SEO)

  • B2B Marketing & Lead Generation

  • Social Media Management

  • AI Powered Customer Support Chatbot

  • Social Media Post Automation

  • AI Powered Products Ads Creation

  • Podcast & Training Creation

  • AI Powered Business Utility Creation

  • Data Scraping & AI Analysis

AI Powered Automations
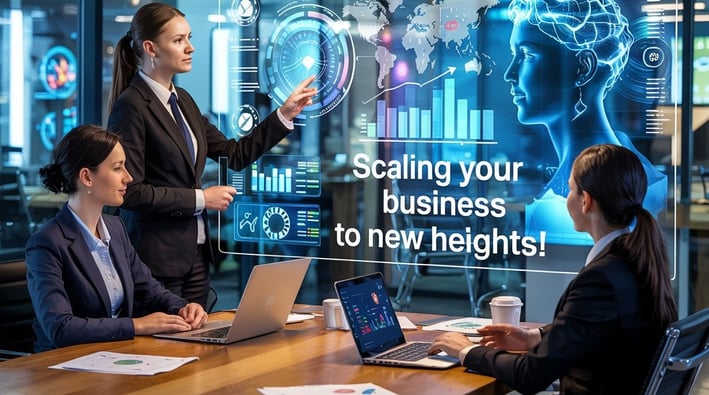
Why Dizitalmist ?

Transforming brands through data-driven business and marketing insights.

Market Understanding

Maximizing reach with predictive analytics and automation.

A glowing neon sign displaying the letters 'AI' is mounted on a dark, textured wall that resembles a circuit board or technological pattern.
Solutions at low cost

Combining human intelligence with AI for impactful results.

A computer screen displaying analytics dashboards with various charts, including a line graph on the left and a cohort analysis table on the right. The table is populated with different shades of blue, indicating varying levels of user activity over several weeks. Text labels and numbers detail user retention statistics.
A computer screen displaying a data analytics dashboard with graphs and charts. A blue line graph shows fluctuations in data over time, and a section highlights the number of page views. A pie chart is partially visible, indicating a breakdown of different data elements.
Real-Time Optimization

Adapting strategies based on live market feedback.

AI Advantage

Deep understanding of audience behavior decreasing targeting cost

Dizitalmist transformed our marketing approach with their innovative strategies and deep customer insights. Their AI-driven analytics truly set them apart from traditional agencies.

David Brian, Owner , The Smile Dentistry

A digital dashboard displaying various analytics charts and graphs. There is a line graph showing user engagement over time on the left, a section with total revenue marked as $74K, and bar charts illustrating user statistics by region. The central section highlights users in the last 30 minutes, focusing on different countries such as the United States, Canada, India, Pakistan, and Brazil.

★★★★